Chart of the Day: Stocks in the Rear View Mirror
Contents
About the Author

All of our locations will be closed on Saturday, July 4, in celebration of Independence Day.
Take the first step toward securing your legacy. Attend a complimentary estate-planning seminar.
Investment products are not insured by the FDIC, are not deposits, and may lose value.
FDIC-Insured - Backed by the full faith and credit of the U.S. Government
BankFind
This bank is insured by the Federal Deposit Insurance Corporation. The FDIC Certificate ID is 8021. Click on the Certificate ID # to confirm this bank's FDIC coverage using the FDIC's BankFind tool.
EDIE
EDIE lets consumers and bankers know, on a per-bank basis, how the insurance rules and limits apply to a depositor's accounts-what's insured and what portion (if any) exceeds coverage limits at that bank. Check your deposit insurance coverage >>

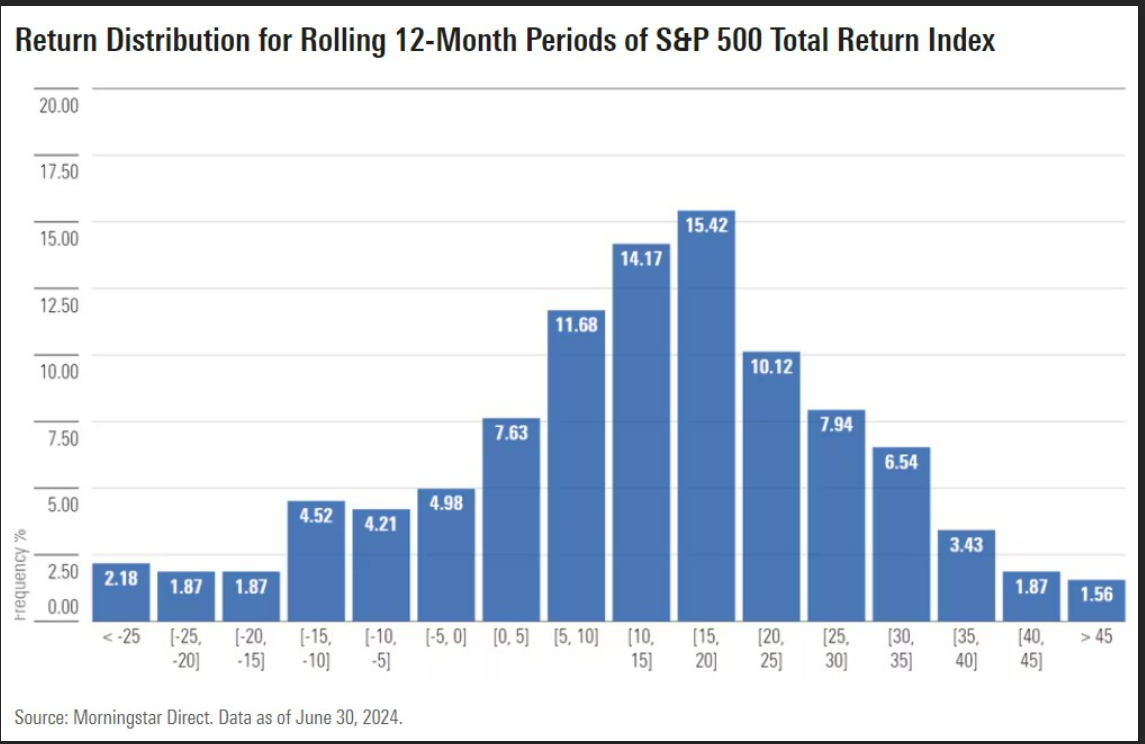
Today’s Chart of the Day from a Morningstar article about “Buffer” ETFs (aka exchange-traded funds), shows the distribution of returns for rolling 12-month periods for the stock market.
The blue bars represent the percentage of time they are within the ranges of returns. The average return of the stock market has been 10% since the 1930's. (Note: During that time, the market returned that 10% return in a 12-month period only 14% of the time.)
The rest of the time, it was lower or higher, leading to the observation, “at any point in time, the stock market never feels normal, and only does when we look back in the rear-view mirror.”
PS: The article about buffer ETFs was one of caution, since yes, they limit your losses but also cap your gains on anything over 9%-10%. When looking at the chart, that happens over 60% of the time. So, buyer beware. There is never a free lunch in the stock market and that’s a lot of return to give up.
Experienced professionals from our wealth management services team can help you achieve a bright financial future through investment strategies tailored to you. We’ll show you all of the options available and help you choose the ones best suited to you. We’ll provide high-quality, personal service as we work toward your goals together. Our Portfolio Managers do not receive commissions on trades; our recommendations of investments are based solely on your best interests.
Investments are not a deposit or other obligation of, or guaranteed by, the bank, are not FDIC insured, not insured by any federal government agency, and are subject to investment risks, including possible loss of principal.