
Chart of the Day: % of Debt Per GDP
Contents
About the Author

Learn how your business can efficiently manage diverse payment needs and get insight into transactions and balances with Crews Treasury Pro. Easy to-use tools put you in control.
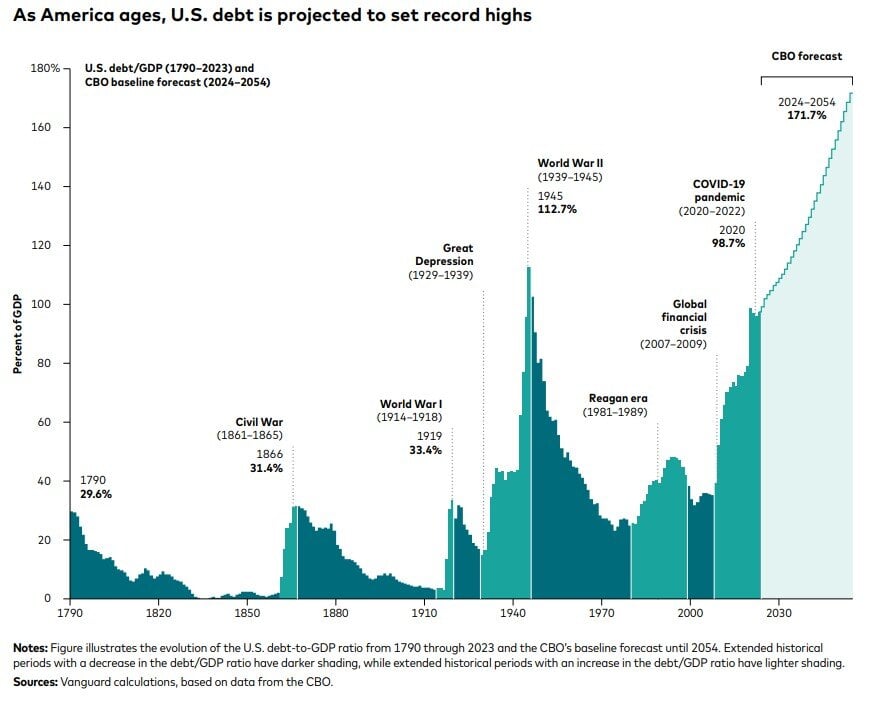
Today’s Chart of the Day from Vanguard shows the US debt as a percentage of GDP (Gross Domestic Product), which is a measure of all the goods and services generated by the United States.This gives some context as the dollar today in proportion to the size of our economy is different than 20 or 40 years ago. Note that the US started printing money after the Great Recession in 2007 and never stopped. We then stepped on the gas during COVID-19. Unfortunately, the levels are now “in the budget” and unless something changes the trajectory is nothing but up. As with all things, we need to keep an eye on because it can’t stay on this path forever.
Samuel serves as Senior Vice President, Chief Investment Officer for the Crews family of banks. He manages the individual investment holdings of his clients, including individuals, families, foundations, and institutions throughout the State of Florida. Samuel has been involved in banking since 1996 and has more than 20 years experience working in wealth management.
Investments are not a deposit or other obligation of, or guaranteed by, the bank, are not FDIC insured, not insured by any federal government agency, and are subject to investment risks, including possible loss of principal.