
Chart of the Day: Pre-Great Recession Average
Contents
About the Author

Plan Today. Protect Tomorrow. Attend an Educational Estate-Planning Seminar.
Start Investing with as little as $10, right from Crews Bank & Trust Online or Mobile Banking.
Investments are not a deposit or other obligation of, or guaranteed by, the bank, are not FDIC insured, not insured by any federal government agency, and are subject to investment risks, including possible loss of principal. Fees may apply.
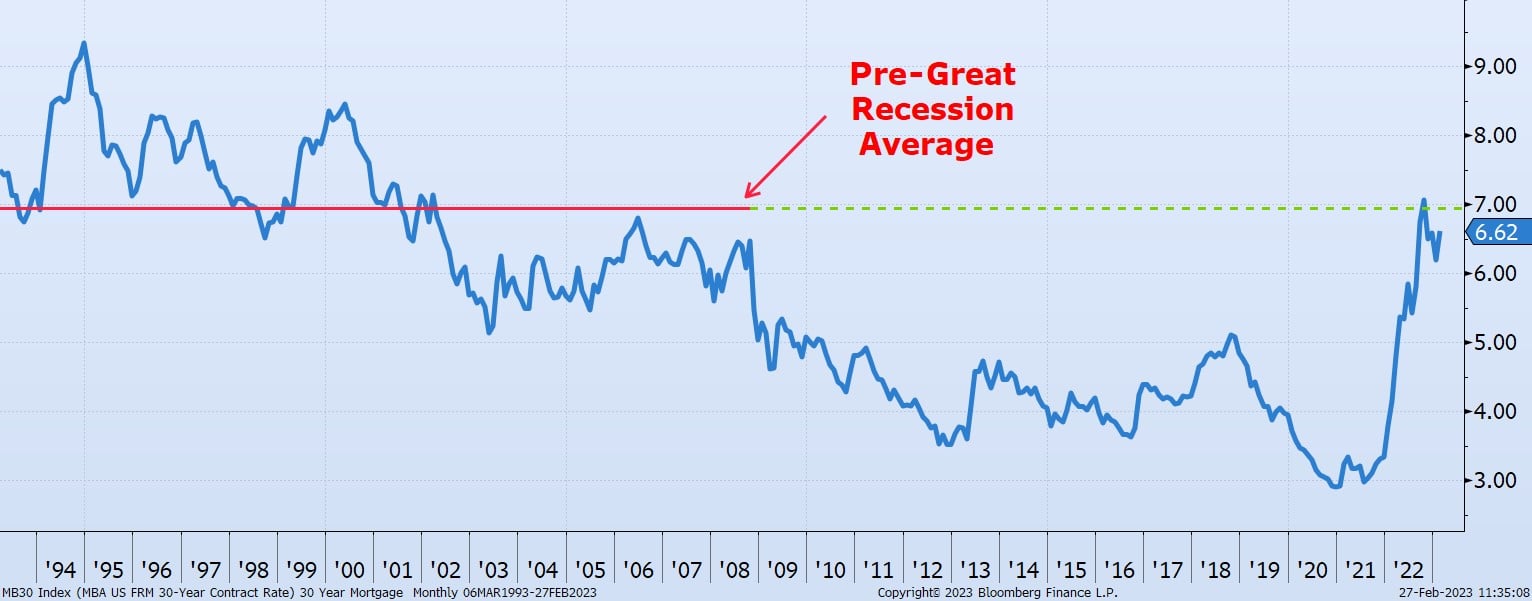
Today's Chart of the Day, compiled from information from the Mortgage Bankers Association, shows the 30-year residential rates dating back to 1993. The hypothesis is: Are we simply returning back to the normal, long-term average we had before the Great Recession, which was a time before quantitative easing kept rates artificially low?
Experienced professionals from our wealth management services team can help you achieve a bright financial future through investment strategies tailored to you. We’ll show you all of the options available and help you choose the ones best suited to you. We’ll provide high-quality, personal service as we work toward your goals together. Our Portfolio Managers do not receive commissions on trades; our recommendations of investments are based solely on your best interests.
Investments are not a deposit or other obligation of, or guaranteed by, the bank, are not FDIC insured, not insured by any federal government agency, and are subject to investment risks, including possible loss of principal.