Chart of the Day: 4th Largest in History
Contents
About the Author

Start investing with as little as $10, right from your Crews Bank & Trust online or mobile banking platform. Learn more.
Not FDIC Insured; No Bank Guarantee; May Lose Value
Urgent Fraud Alert: Fraudsters are calling and pretending to be from the bank’s fraud department. Do not share your account number, username, password, debit card information, PIN, or Social Security number. Hang up immediately — even if caller ID looks like the bank — and contact us directly or visit your local branch.
FDIC-Insured - Backed by the full faith and credit of the U.S. Government
BankFind
This bank is insured by the Federal Deposit Insurance Corporation. The FDIC Certificate ID is 8021. Click on the Certificate ID # to confirm this bank's FDIC coverage using the FDIC's BankFind tool.
EDIE
EDIE lets consumers and bankers know, on a per-bank basis, how the insurance rules and limits apply to a depositor's accounts-what's insured and what portion (if any) exceeds coverage limits at that bank. Check your deposit insurance coverage >>

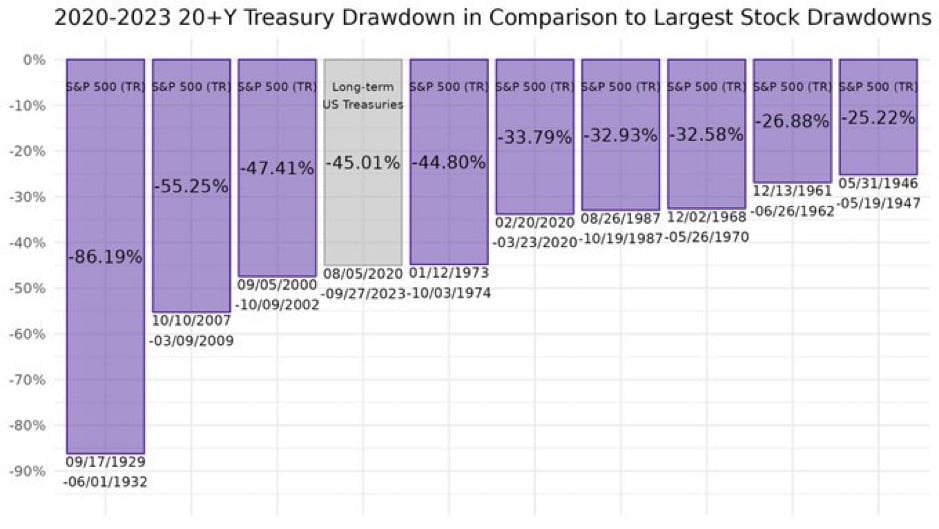
Today’s Chart of the Day from Michael Gayed, @leadlagreport on X, shows the decline in the price of stocks and bonds going back to the Great Depression. If you include the -45% drop of long-term US treasuries that began three years ago in August 2020, you'll see this event is the fourth largest price decline in history and is only dwarfed by the Great Depression, Dot.com, and Great Recession. In August 2020, someone might have been unlucky enough to buy and lock into a 1.2% yield for the next 30 years vs. the current yield of 4.7%. The odds seem against this being a good investment, but 27 years is a long time, and a lot of things can happen along the way. We’ll only truly know if the bond was a good or bad investment when it matures in 2050.
Experienced professionals from our wealth management services team can help you achieve a bright financial future through investment strategies tailored to you. We’ll show you all of the options available and help you choose the ones best suited to you. We’ll provide high-quality, personal service as we work toward your goals together. Our Portfolio Managers do not receive commissions on trades; our recommendations of investments are based solely on your best interests.
Investments are not a deposit or other obligation of, or guaranteed by, the bank, are not FDIC insured, not insured by any federal government agency, and are subject to investment risks, including possible loss of principal.