
Chart of the Day: 90 Years and 15 Presidents
Contents
About the Author

Learn about our Refer-a-Friend Program. Terms and conditions apply.
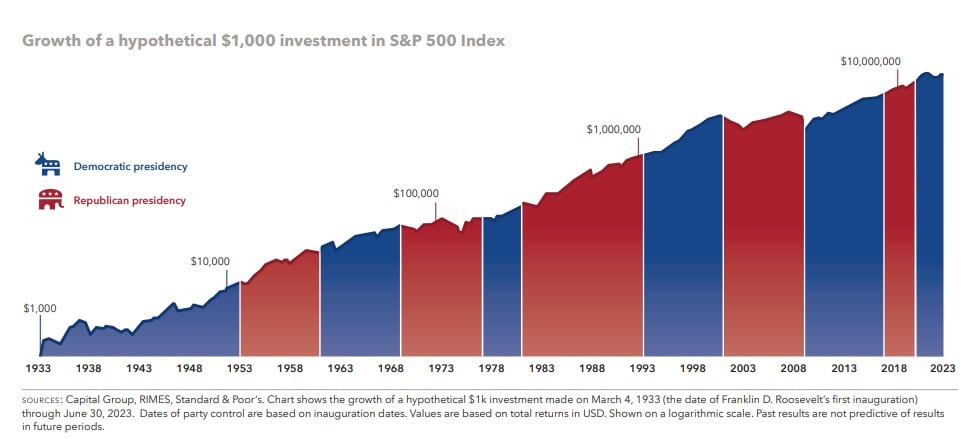
Happy New Year! With 2024 being a presidential election year, today’s Chart of the Day is from Capital Group and shows the hypothetical growth of $1,000 invested in March 1933, when Franklin D. Roosevelt was first inaugurated. About 90 years later, as of June 2023, that $1,000 would be worth $19 million. The chart also shows growth during eight Democratic and seven Republican presidents, showing that the stock market trends up no matter which party wins the White House.
Samuel serves as Senior Vice President, Chief Investment Officer for the Crews family of banks. He manages the individual investment holdings of his clients, including individuals, families, foundations, and institutions throughout the State of Florida. Samuel has been involved in banking since 1996 and has more than 20 years experience working in wealth management.
Investments are not a deposit or other obligation of, or guaranteed by, the bank, are not FDIC insured, not insured by any federal government agency, and are subject to investment risks, including possible loss of principal.