Chart of the Day: Markets in Election Years
Contents
About the Author

Be financially ready for hurricane season. Access funds when you need them with a Home Equity Line of Credit (HELOC). Loans subject to credit approval. NMLS #406389
FDIC-Insured - Backed by the full faith and credit of the U.S. Government
BankFind
This bank is insured by the Federal Deposit Insurance Corporation. The FDIC Certificate ID is 8021. Click on the Certificate ID # to confirm this bank's FDIC coverage using the FDIC's BankFind tool.
EDIE
EDIE lets consumers and bankers know, on a per-bank basis, how the insurance rules and limits apply to a depositor's accounts-what's insured and what portion (if any) exceeds coverage limits at that bank. Check your deposit insurance coverage >>

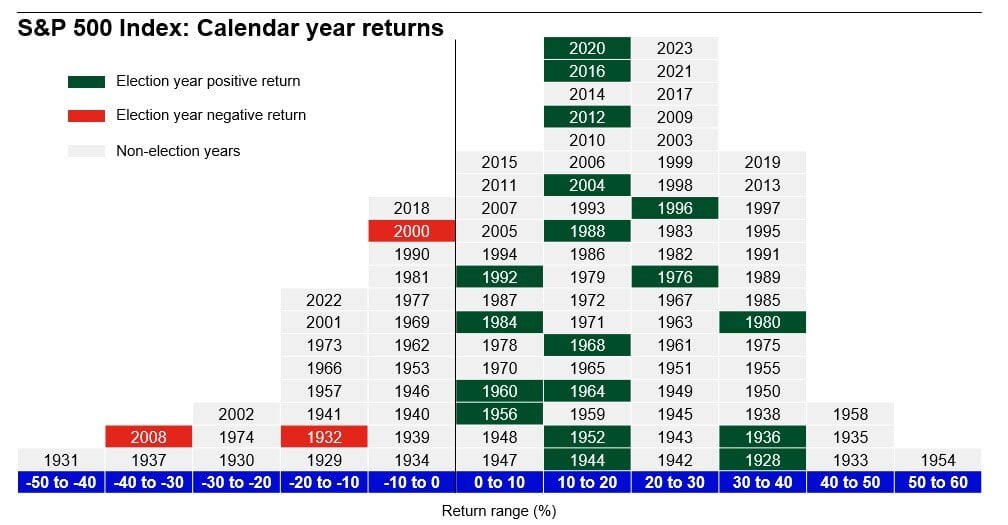
Today’s Chart of the Day was provided by Angie Parsons, a Portfolio Manager at Crews Bank & Trust, after attending a presentation by Brian Levitt with Invesco called, “Is the Second Half of Elections Bad for the Markets?”
Past performance is no guarantee of future results, but the stock market represented by the S&P 500 has been positive (shown in green) for 18 of the 21 election years going back to 1930. Additional information in the presentation also proved “No” to the second half question, with the market posting a median gain of 5.5%.
Side note: The only three negative years - 1932, 2000, and 2008 - occurred during recessions.
Experienced professionals from our wealth management services team can help you achieve a bright financial future through investment strategies tailored to you. We’ll show you all of the options available and help you choose the ones best suited to you. We’ll provide high-quality, personal service as we work toward your goals together. Our Portfolio Managers do not receive commissions on trades; our recommendations of investments are based solely on your best interests.
Investments are not a deposit or other obligation of, or guaranteed by, the bank, are not FDIC insured, not insured by any federal government agency, and are subject to investment risks, including possible loss of principal.