
Chart of the Day: Rolling, Rolling, Rolling
Contents
About the Author

Learn about our Refer-a-Friend Program. Terms and conditions apply.
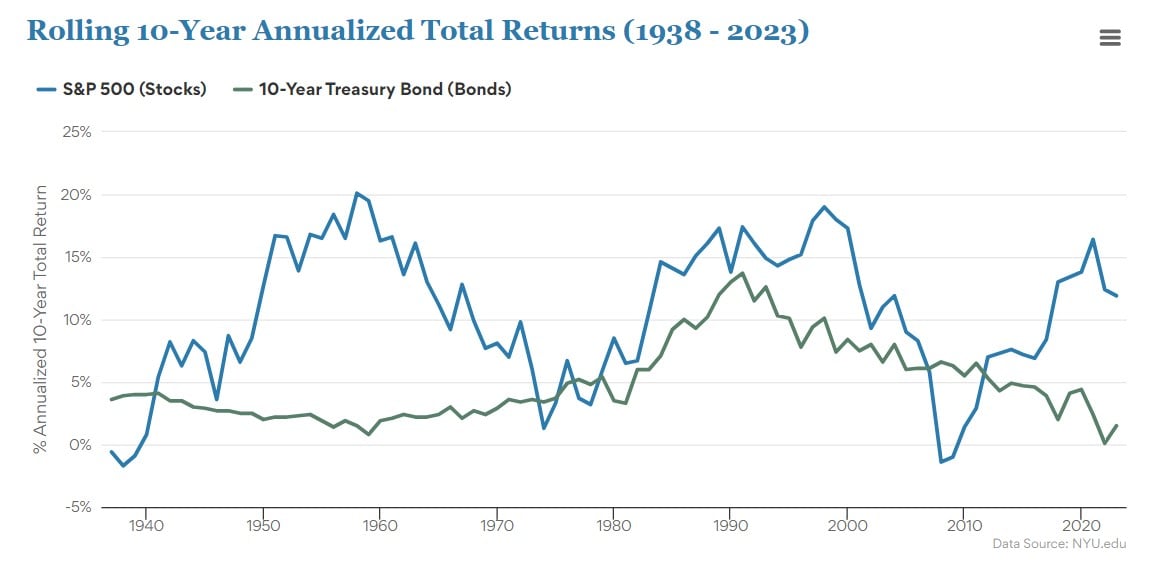
Today’s Chart of the Day from Creativeplanning.com with data from NYE.edu shows the rolling 10-year return of the market going back 85 years. The stock market is represented by the S&P 500 in blue and the 10-Year Treasury bond is in green.
Over 94% of the time, the 10-year return of the stock market was positive. Two periods were the exception, the first being the recession in the mid-70s and the second being the Great Recession in the 2000s. It also shows the vast majority of returns for the stock market are higher than the 10-Year Treasury.
Samuel serves as Senior Vice President, Chief Investment Officer for the Crews family of banks. He manages the individual investment holdings of his clients, including individuals, families, foundations, and institutions throughout the State of Florida. Samuel has been involved in banking since 1996 and has more than 20 years experience working in wealth management.
Investments are not a deposit or other obligation of, or guaranteed by, the bank, are not FDIC insured, not insured by any federal government agency, and are subject to investment risks, including possible loss of principal.