
Chart of the Day: The Dow's Double Double
Contents
About the Author

Learn about our Refer-a-Friend Program. Terms and conditions apply.
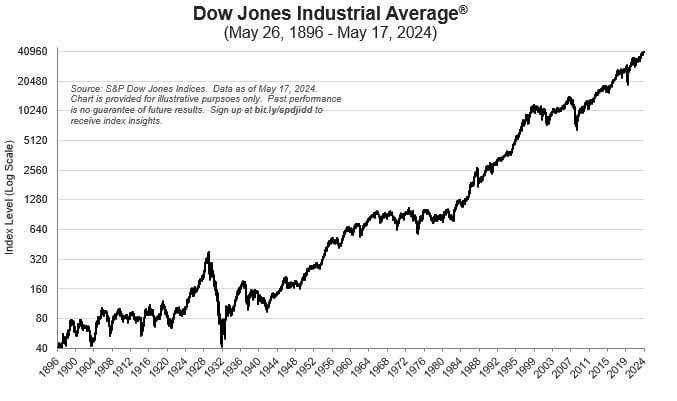
Today’s Chart of the Day is from the S&P Dow Jones Indices showing the history of the Dow Jones Industrial Average index. It started in 1896 at 40 and recently reached 40,000.The chart highlights the power of the Log Scale, which gives the same space on the chart from 40 to 80, as 20,000 to 40,000 which both reflect the figures have doubled. If the scale was not used, the recent part of the chart would look like it goes straight to the moon. This is especially true if the market goes up 7% over the next 10 years and the index doubles to 80,000 and doubles again to 160,000 20 years from now. That will be a long way from the 40 from so long ago.
Samuel serves as Senior Vice President, Chief Investment Officer for the Crews family of banks. He manages the individual investment holdings of his clients, including individuals, families, foundations, and institutions throughout the State of Florida. Samuel has been involved in banking since 1996 and has more than 20 years experience working in wealth management.
Investments are not a deposit or other obligation of, or guaranteed by, the bank, are not FDIC insured, not insured by any federal government agency, and are subject to investment risks, including possible loss of principal.