Chart of the Day - Lower Rates Don't Always Means Lower Mortgage Rates
Contents
About the Author

In observance of Juneteenth, all of our locations will be closed on Friday, June 19.
Start investing with as little as $10, right from your Crews Bank & Trust online or mobile banking platform. Learn more.
Not FDIC Insured; No Bank Guarantee; May Lose Value
FDIC-Insured - Backed by the full faith and credit of the U.S. Government
BankFind
This bank is insured by the Federal Deposit Insurance Corporation. The FDIC Certificate ID is 8021. Click on the Certificate ID # to confirm this bank's FDIC coverage using the FDIC's BankFind tool.
EDIE
EDIE lets consumers and bankers know, on a per-bank basis, how the insurance rules and limits apply to a depositor's accounts-what's insured and what portion (if any) exceeds coverage limits at that bank. Check your deposit insurance coverage >>

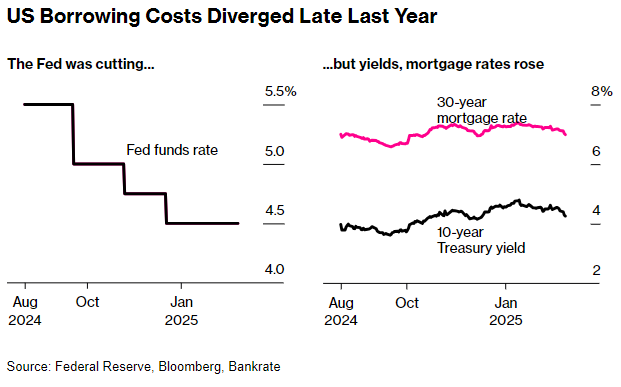
Today’s Chart of the Day was shared by my colleague, and fellow Portfolio Manger, Angie Parsons. It's a from Bloomberg article showing the changes in the short-term Fed funds rate, 30-year mortgage rates and 10-year Treasury rates since August 2024.
The Fed funds rate is a short-term rate that banks charge for lending excess cash overnight and is a key tool the uses Federal Reserve to manage the money supply.
The chart shows when the Fed cuts the Fed fund rate it doesn’t always lead to lower mortgage rates. This is because 30-year mortgage rates follow the longer term 10-year Treasury rate, which is determined by the market's longer-term expectations of inflation, economic growth, and consumer spending.
While 10-Year Treasury rates and mortgage rates tend to move in similar patterns, they have different risk profiles. Since mortgages have higher risks than Treasury bonds, they require a higher rate, which is historically 1.70% to 2.25% (2% as a rule of thumb) above the 10-year Treasury rate.
Experienced professionals from our wealth management services team can help you achieve a bright financial future through investment strategies tailored to you. We’ll show you all of the options available and help you choose the ones best suited to you. We’ll provide high-quality, personal service as we work toward your goals together. Our Portfolio Managers do not receive commissions on trades; our recommendations of investments are based solely on your best interests.
Investments are not a deposit or other obligation of, or guaranteed by, the bank, are not FDIC insured, not insured by any federal government agency, and are subject to investment risks, including possible loss of principal.