
Chart of the Day: Positive Returns During Recessions
Contents
About the Author

Learn about our Refer-a-Friend Program. Terms and conditions apply.
Today’s Chart of the Day and commentary is from Angie Parsons, my colleague and fellow Portfolio Manager.
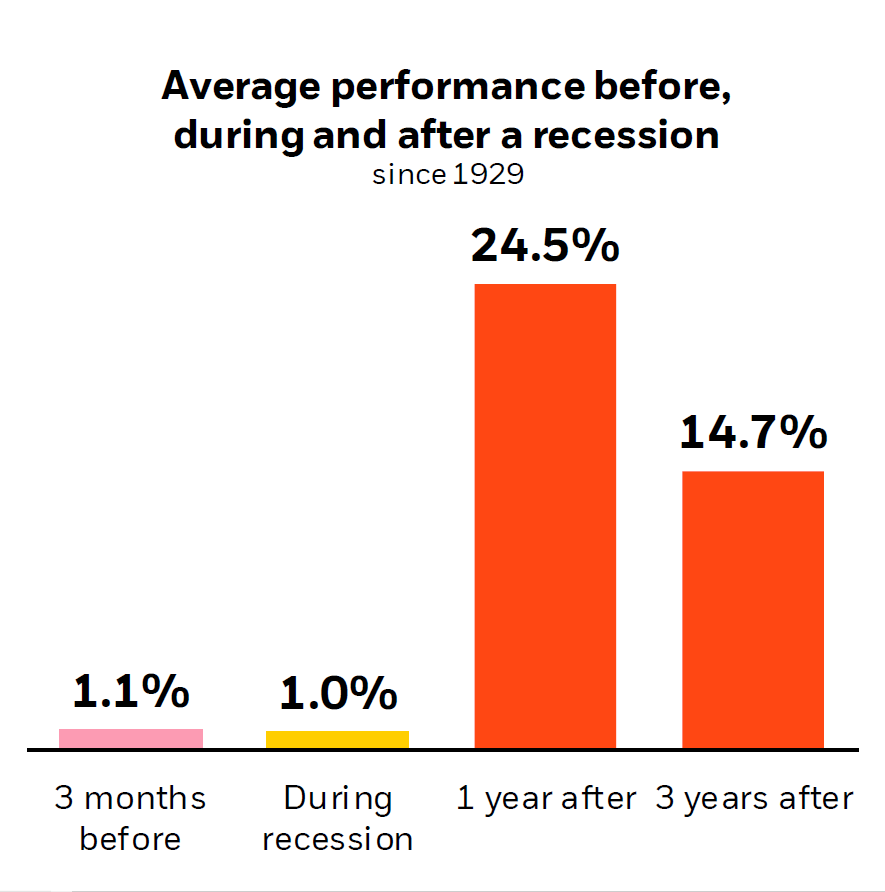
The chart from BlackRock shows stock returns during recessions dating back to 1929. Surprisingly, the average return is positive and increases to 25% the next year afterwards. This highlights that although market downturns sometimes coincide with recessions, the stock market is not a good indicator of the current state of the economy. The reason is the stock market often looks past the short-term and instead looks well into the future. Therefore, more often than not, the stock market recovers faster than the economy.
Though recessions seem to be long, the average length of a recession is roughly one year vs. expansionary periods of roughly six years. This means that though they happen, they generally don’t happen for long and if you have the right bond allocation to protect yourself, they often become blips in our memory.
Samuel serves as Senior Vice President, Chief Investment Officer for the Crews family of banks. He manages the individual investment holdings of his clients, including individuals, families, foundations, and institutions throughout the State of Florida. Samuel has been involved in banking since 1996 and has more than 20 years experience working in wealth management.
Investments are not a deposit or other obligation of, or guaranteed by, the bank, are not FDIC insured, not insured by any federal government agency, and are subject to investment risks, including possible loss of principal.