

In Fixed Income, the Dip is Not Always an Opportunity
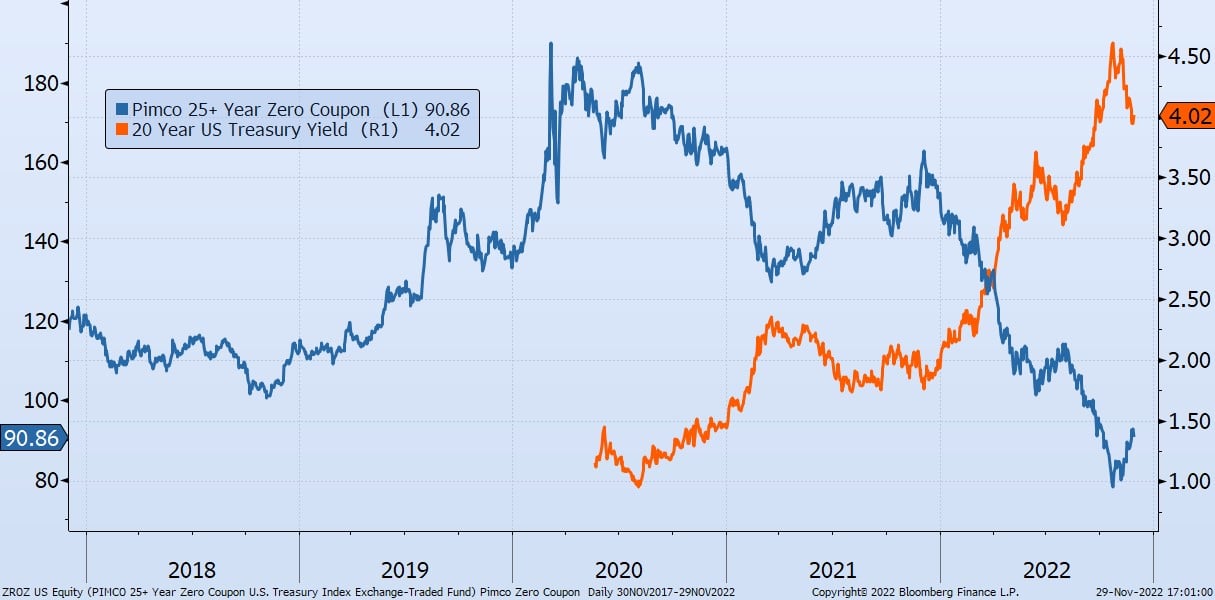
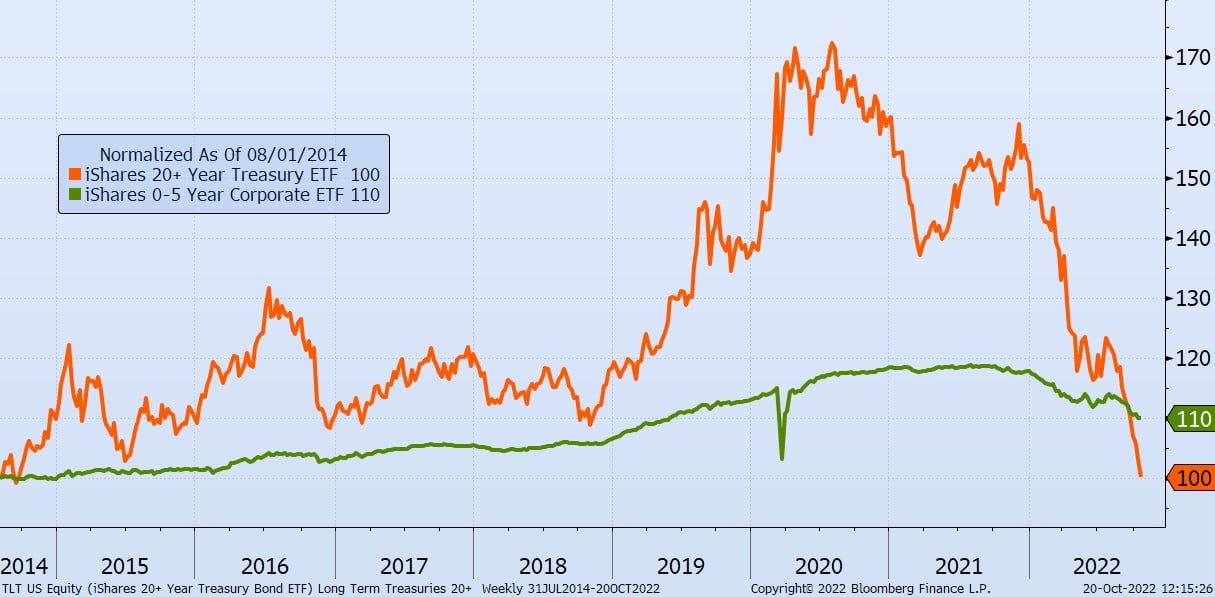
Today’s Chart of the Day is the five-year performance of the PIMCO over 25-year Zero Coupon Treasury (ZROC) in blue versus the 20-year US Treasury Yield in orange. Since the peak at $189 in 2020, the value of the PIMCO fund has declined 70% to only $90.
According to VettaFi, “ZROZ invests exclusively in . . . the final principal payments of U.S. Treasuries with at least 25 years remaining until maturity. As such, this product will be very sensitive to changes in interest rate movements, performing very well when rates fall but likely struggling if rates begin to climb.”
The reason for the volatility is the fact that there are no interest payments during the life of the loan, and only one payment of principal at the end, there is no chance to reinvest periodic interest payments at higher rates when rates rise. Or conversely, run the risk of reinvesting the interest payment at a lower rate when rates decline.
Why invest in such a product you may ask? Where does the stated return of 3.80% come from? Well, as an example, when a zero coupon bond was issued it could be purchased for $40, then held for 25 years until you get $100 back at maturity.
When the 20-year rates were 1.00% in the summer of 2020, the 3.80% guaranteed appreciation in your principal for the 25 years looked very attractive, hence the near doubling of the price. However, when rates are at their current yield of 4.00% the price fell just as dramatically and is now back to its normal “pre-pandemic” price.
What can we learn?
We can learn that in fixed income, just because bond’s price is down 70%, this does not mean it is “on sale” or provide an opportunity to “buy the dip.” The 3.80% yield you see is what you get when you hold it to maturity. No more, no less. The rate will not change and therefore provides no real “buying opportunity.”
This is evident in this investment, since despite the wild ride up and back down, the investor simply is back to where they started, earning their original 3.8% for the next 25 years.