


Chart of the Day: Women Work More Than Men
Today’s Chart of the Day from Statista breaks down how men (arrow) and women (cross) around the world spend their time on both paid and unpaid work each day.
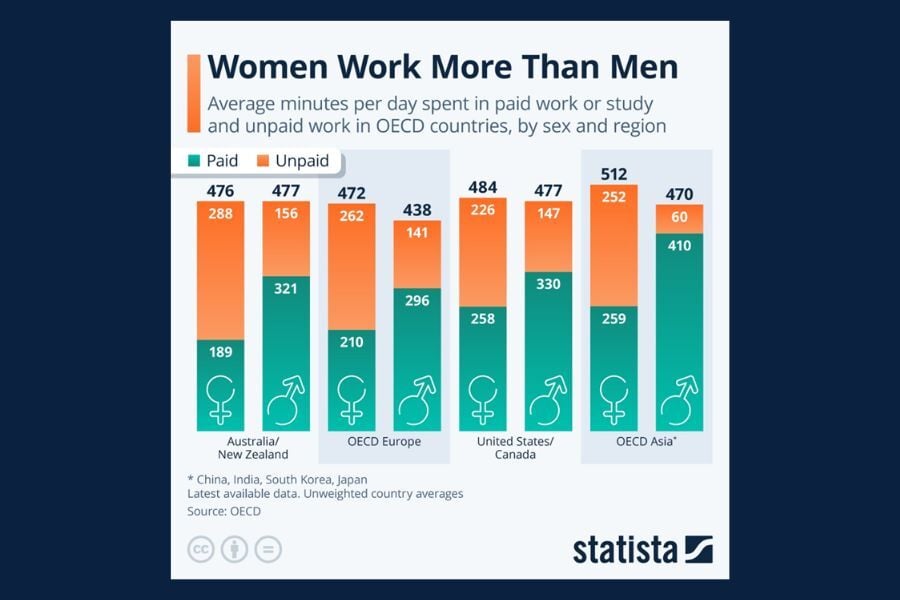
Today’s Chart of the Day from Statista breaks down how men (arrow) and women (cross) around the world spend their time on both paid and unpaid work..
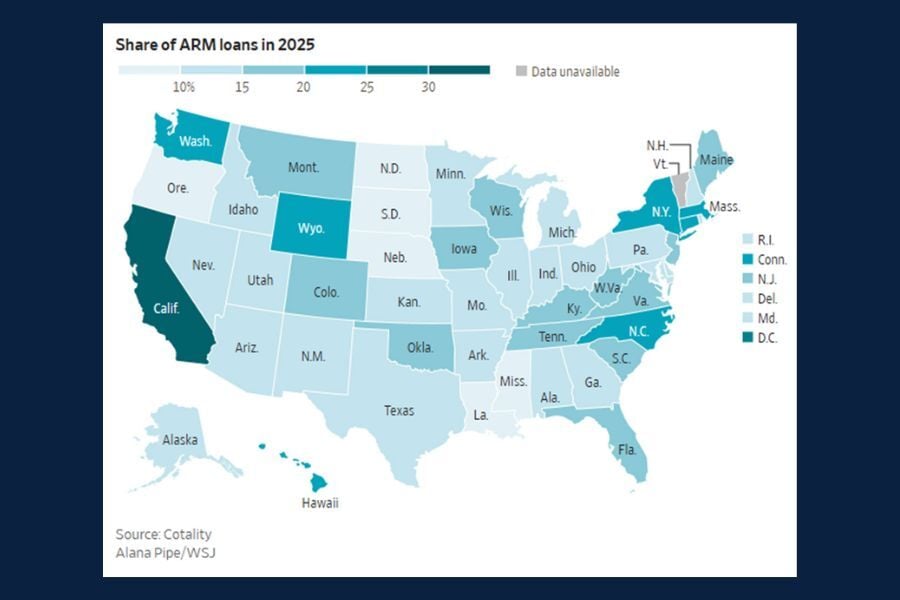
Today's Chart of the Day from the Wall Street Journal article " How Homeowners Are Turning to Adjustable-Rate Mortgages, in Charts" addresses the..
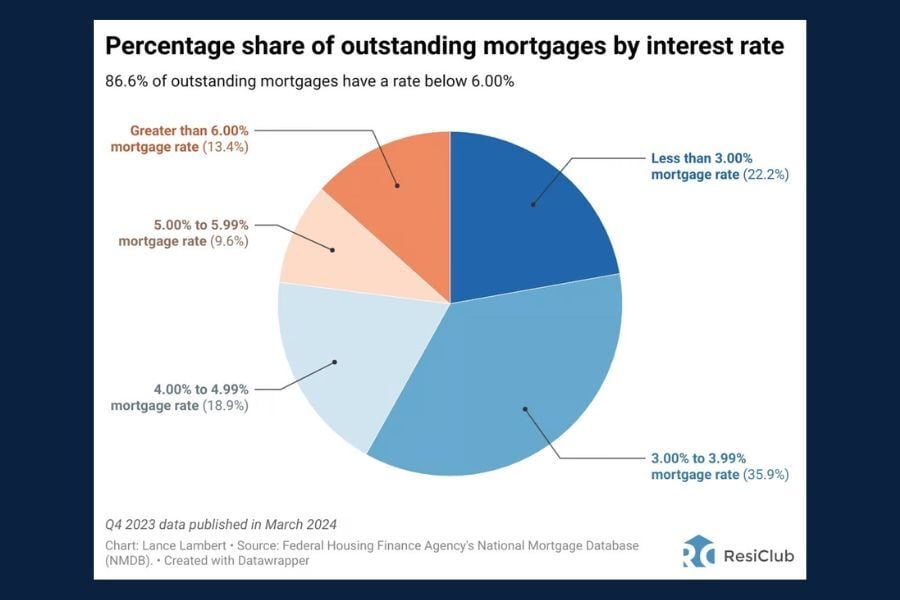
Today’s Chart of the Day from ResiClub gives a clear snapshot of the interest rates attached to currrent outstanding mortgages.
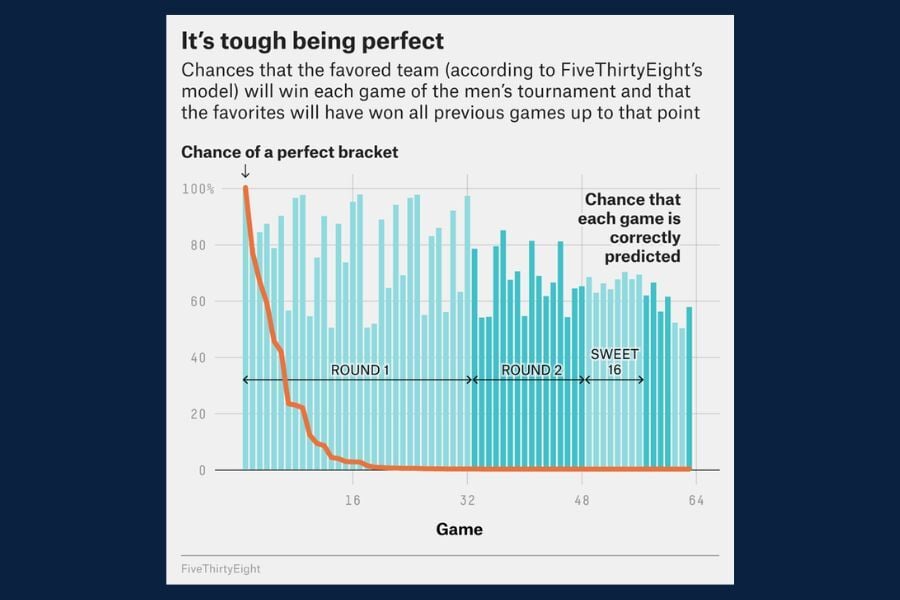
Today’s Chart of the Day from FiveThirtyEight highlights some truly eye‑popping statistics surrounding the NCAA March Madness Tournament.

Today’s Chart of the Day, sourced from FactSet, highlights five years of quarterly data on the S&P 500’s net profit margin.
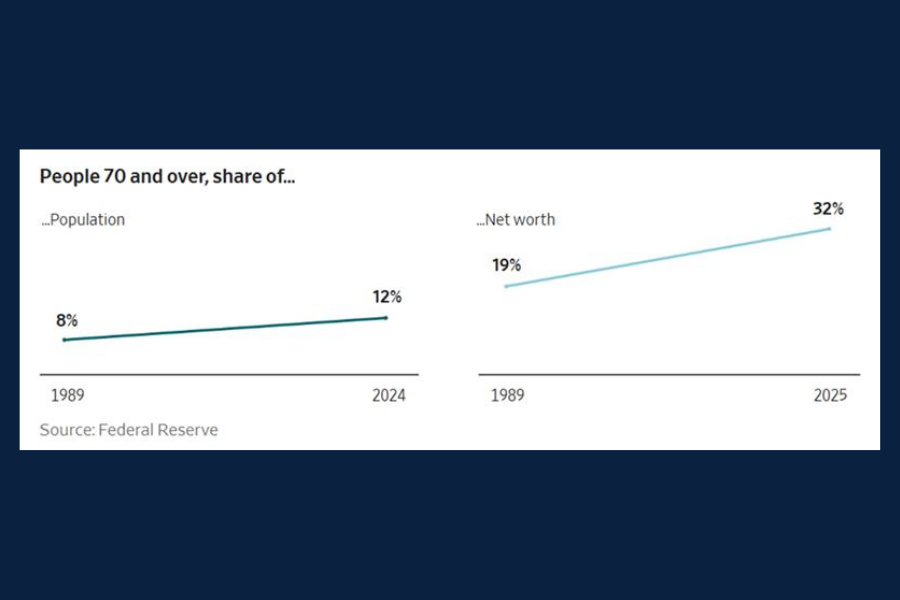
Today's Chart of the Day comes from the Wall Street Journal article, " Over 65? Congratulations, You Own the Economy," and highlights population and..
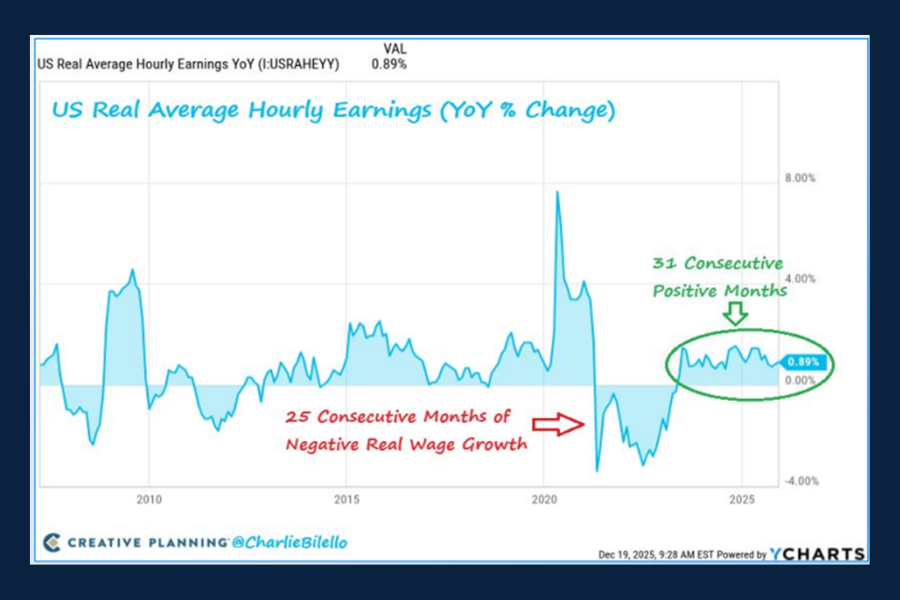
Today's Chart of the Day comes from @CharlieBilello and highlights real average hourly earnings in the US. “Real wages” (pay adjusted for inflation)..
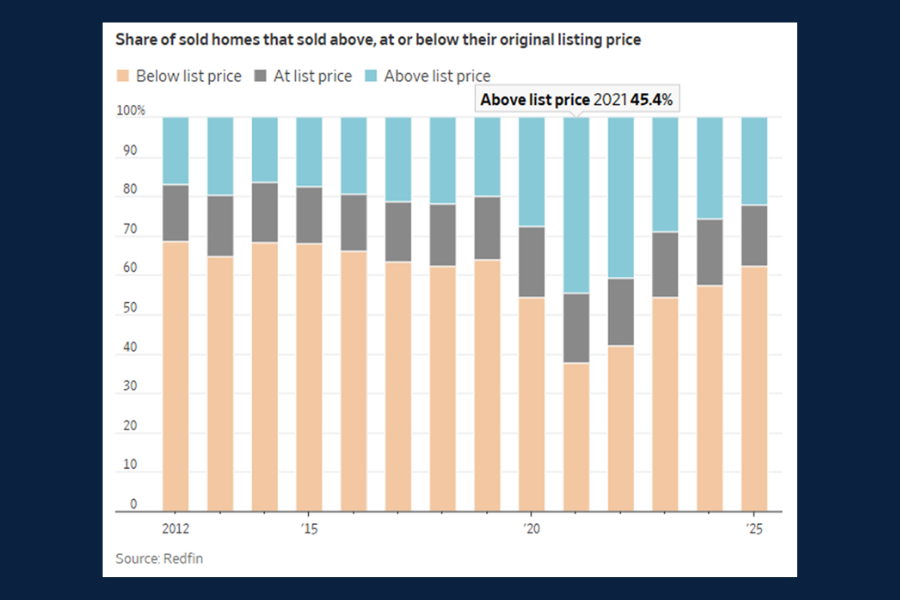
Today's Chart of the Day is actually two charts from The Wall Street Journal article “The Housing Market Is Swinging Toward Buyers.”
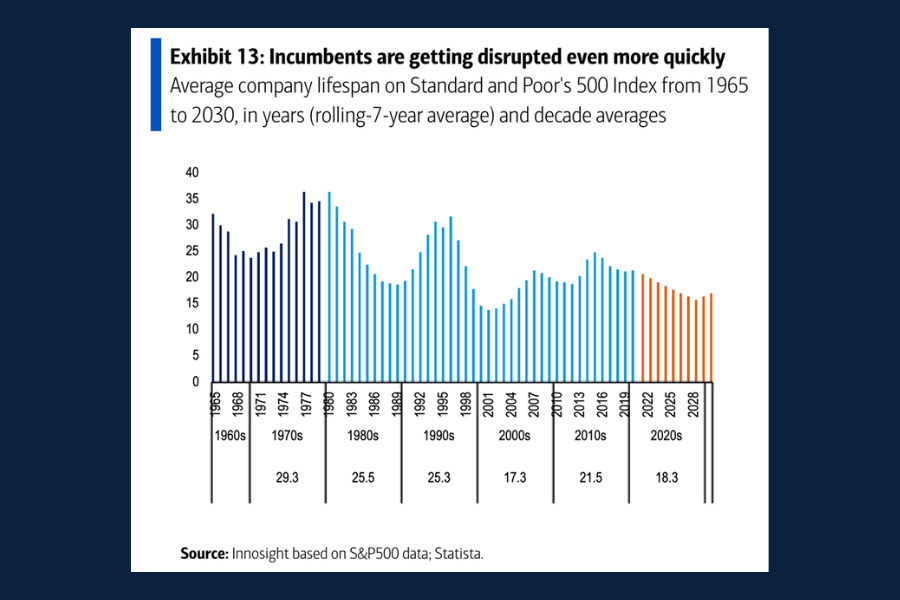
Today’s Chart of the Day from MSN reveals an important trend: S&P 500 companies aren’t holding onto their place in the index as long as they used to.
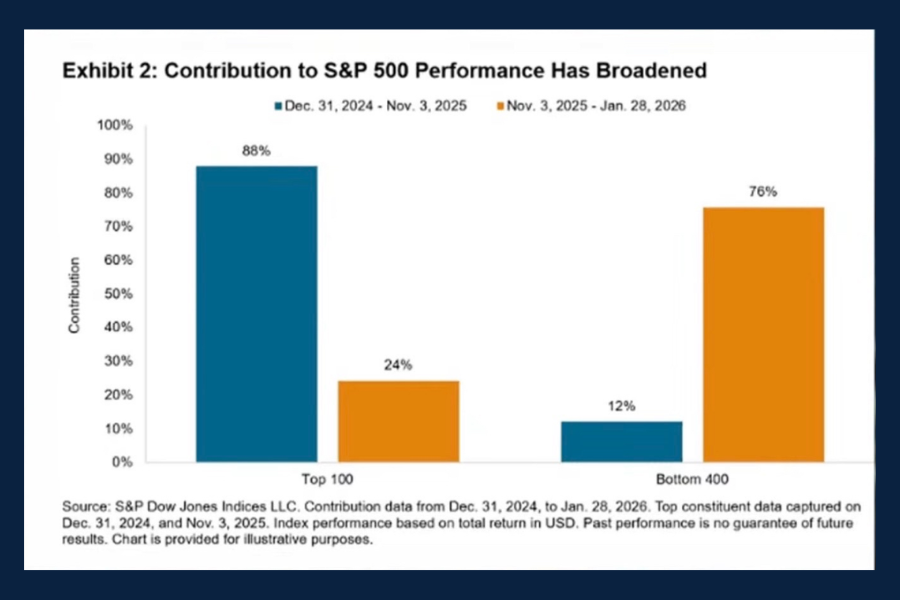
Today's Chart of the Day from Seeking Alpha shows a unique shift of S&P 500 Contribution trends.
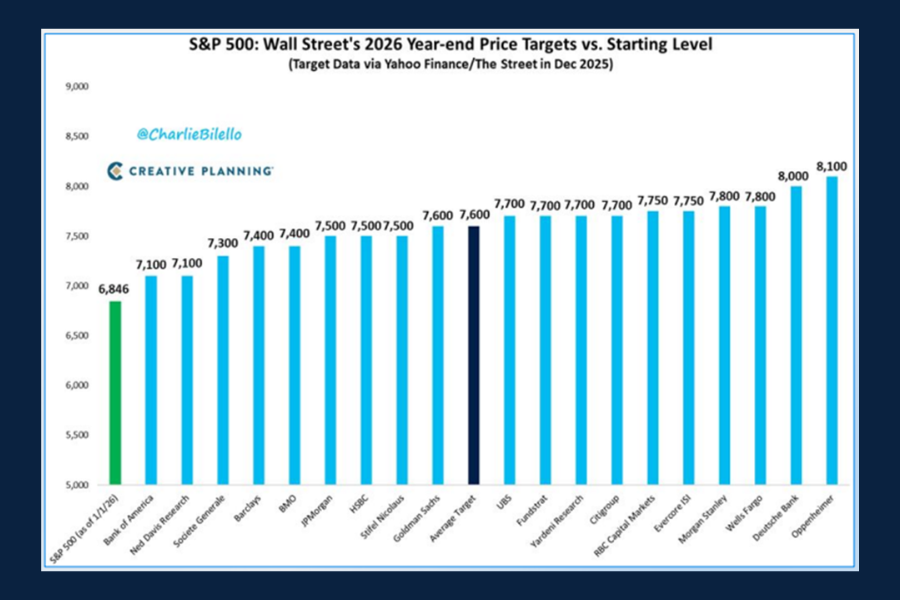
Today’s Chart of the Day, shared by Charlie Bilello, highlights year‑end price targets for the S&P 500 as forecasted by major Wall Street banks.
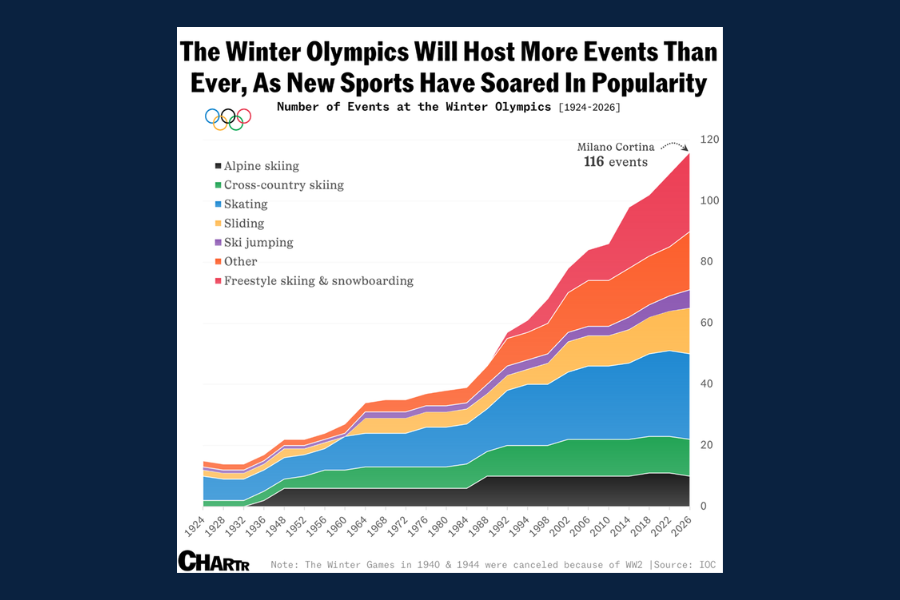
Following the conclusion of the 2026 Winter Olympics, today’s Chart of the Day comes from Chartr, highlighting the expansion of the Winter Games..
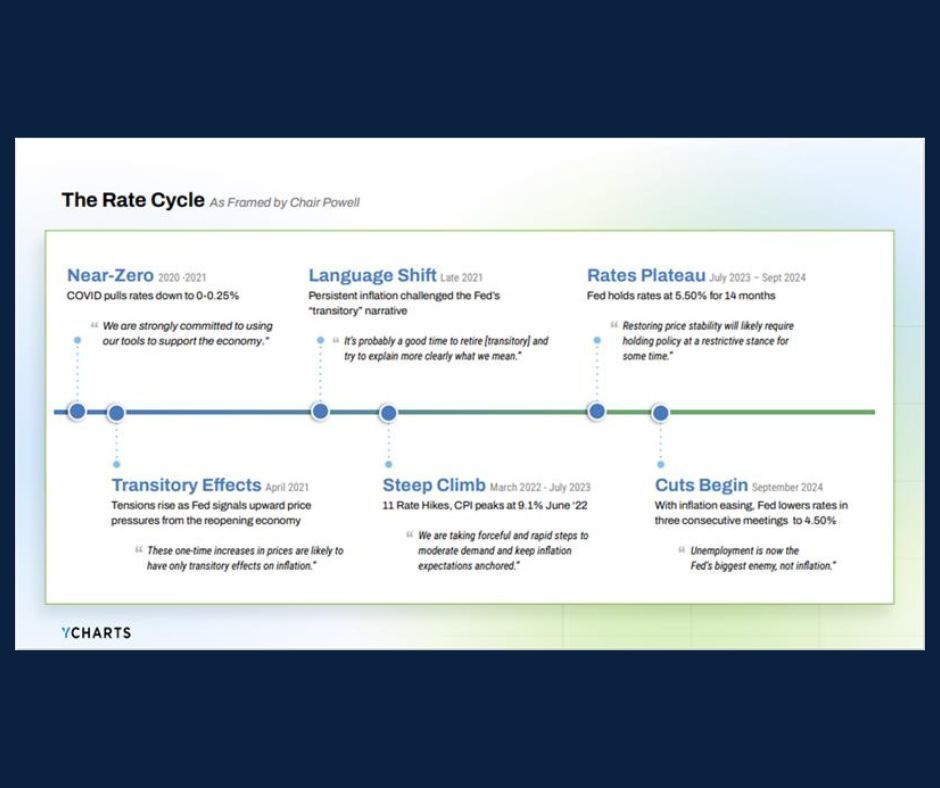
With the current Federal Reserve Chair’s term set to conclude this May, today's Chart of the Day from YCharts looks back at the interest‑rate cycle..
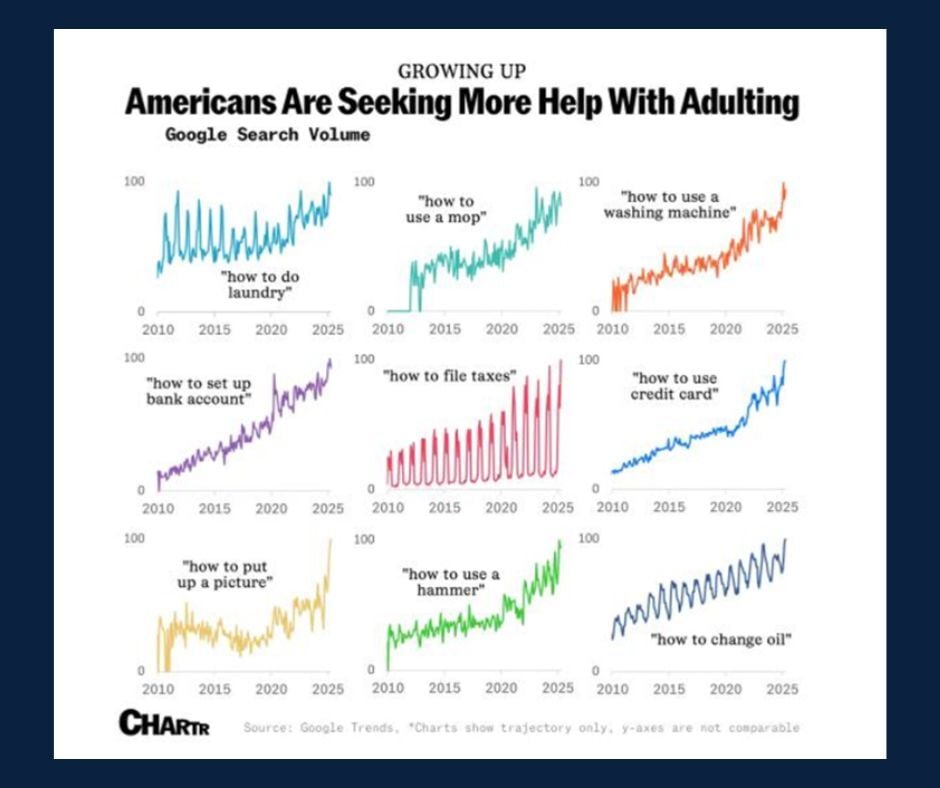
Today's Chart of the Day from Chartr shows a steady rise in Google searches for basic “adulting” tasks—from doing laundry and using a mop to filing..
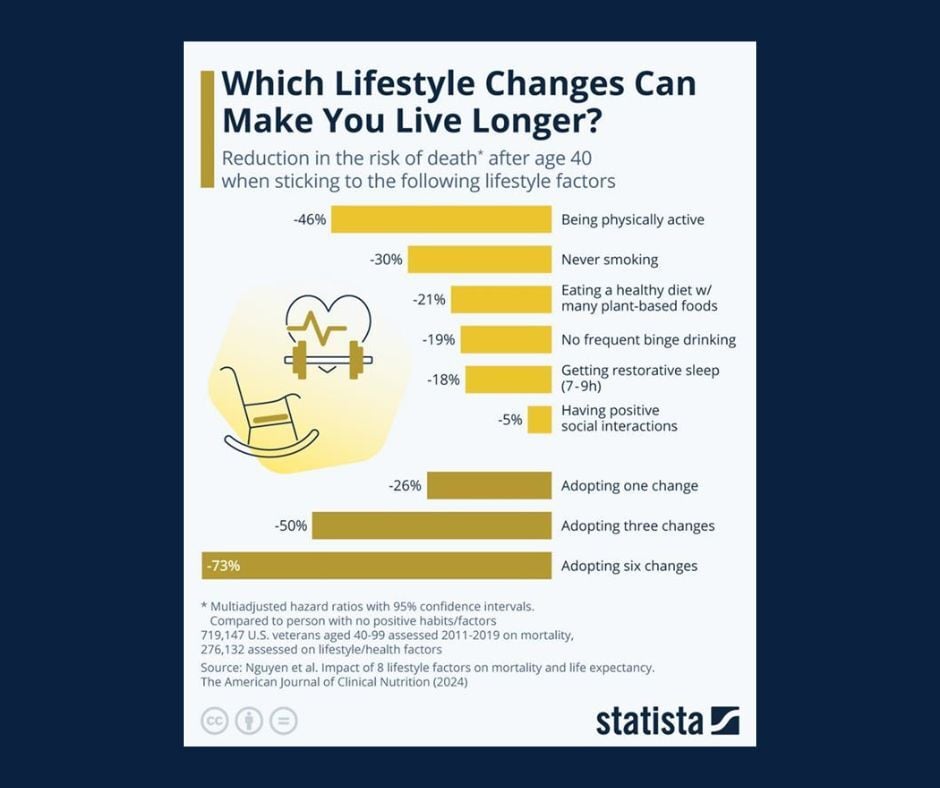
Today's Chart of the Day from Statista highlights how everyday habits can meaningfully influence longevity, especially after age 40.