
Chart of the Day: Old Tech vs. New Tech
Contents
About the Author

Turn your smartphone or smartwatch into a secure payment tool by adding your Crews Bank & Trust debit card to your mobile wallet. It's a safe, simple way to pay with Apple Pay™, Samsung Pay, or Google Pay. Learn more.
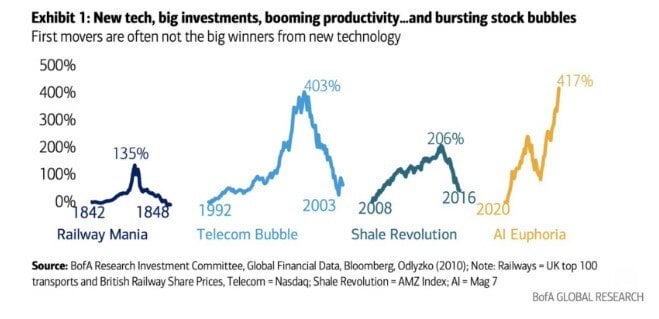
Today’s Chart of the Day from Bank of America is more of a “buyer beware” to those oversaturated in AI. It's important to understand the risks that other new technology experienced. Quite simply, there was a boom and then a bust. Notably, in the Telecom Bubble from 1992 to 1999 the market went up 403% vs. the current AI boom 417%. The past is no predictor, but understanding the past can prepare us for possible risks in the future.
Side note: The chart reminds us of the Shale Revolution, where our increased efficiency to frack for oil was THE catalyst to turn the market out of the Great Recession and without it the downturn may have lasted much longer.
Experienced professionals from our wealth management services team can help you achieve a bright financial future through investment strategies tailored to you. We’ll show you all of the options available and help you choose the ones best suited to you. We’ll provide high-quality, personal service as we work toward your goals together. Our Portfolio Managers do not receive commissions on trades; our recommendations of investments are based solely on your best interests.
Investments are not a deposit or other obligation of, or guaranteed by, the bank, are not FDIC insured, not insured by any federal government agency, and are subject to investment risks, including possible loss of principal.