
Chart of the Day: Payments on Houses
Contents
About the Author

Attend a free seminar to learn the tools of a proper estate plan so you can choose the right path for you and your loved ones.
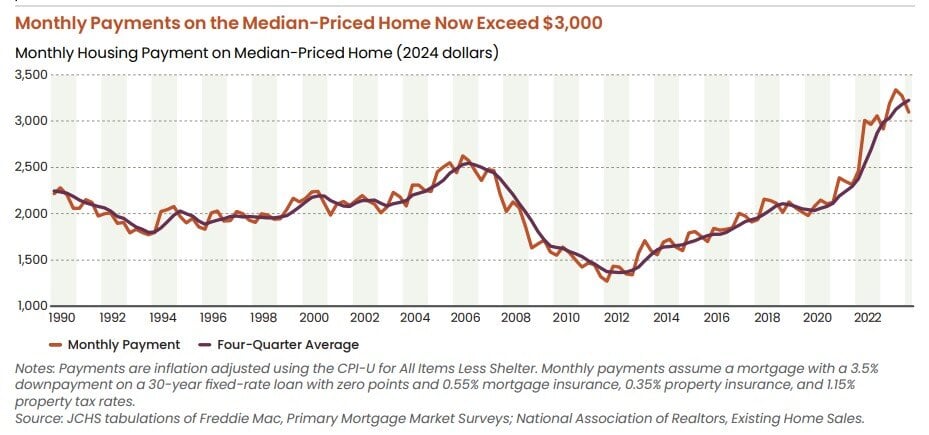
Today’s Chart of the Day is from the 2024 State of the Nation's Housing Report from the Joint Center for Housing Studies at Harvard University. It shows the average inflation-adjusted monthly payment, including taxes and insurance, on a median-priced home in the US from 1990 to present. Currently, it is at a record high of $3,100 a month.
According to article, the industry standards for affordability calculates the annual income needed for this is $120,000, which only one in seven renters can meet.
Samuel serves as Senior Vice President, Chief Investment Officer for the Crews family of banks. He manages the individual investment holdings of his clients, including individuals, families, foundations, and institutions throughout the State of Florida. Samuel has been involved in banking since 1996 and has more than 20 years experience working in wealth management.
Investments are not a deposit or other obligation of, or guaranteed by, the bank, are not FDIC insured, not insured by any federal government agency, and are subject to investment risks, including possible loss of principal.