
Chart of the Day - Trust in Media is 'None at All'
Contents
About the Author

Learn about our Refer-a-Friend Program. Terms and conditions apply.
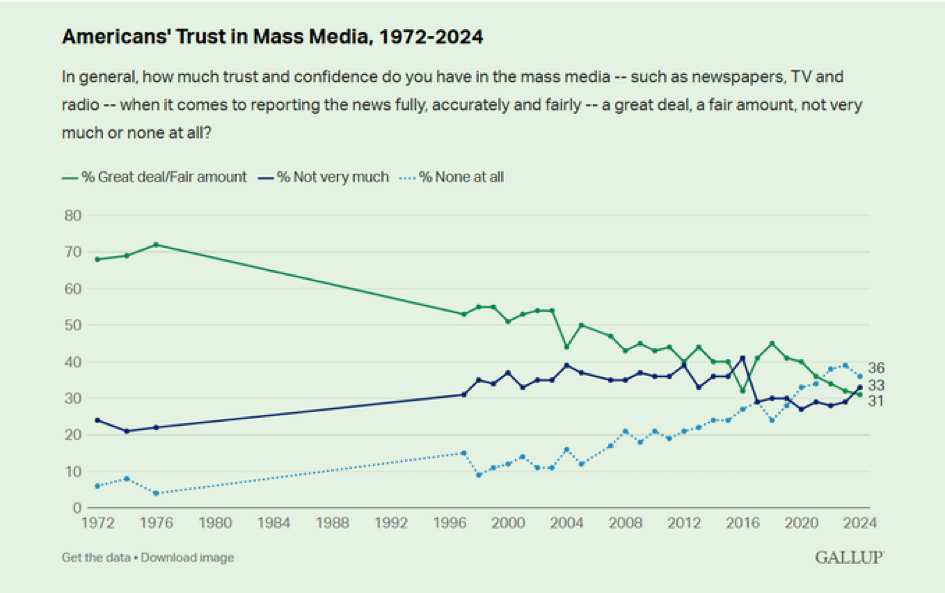
Today’s Chart of the Day is from Gallup and shows the change in American’s Trust in Mass Media from 1972 to 2024. The choice of “None at all” went from a low of 5% in 1972 to the high of 36% in 2024, beating out “Great deal/Fair amount,” which fell from a peak of 68% to its lowest of 31%.
The article suggests this coincides with the 1980 start of the 24-hour news cycle, further fueled by additional news channels in the 1990s, then the invention of social media in early 2000’s, culminating with the rise of smart phones in the early 2010’s.
Where do we go from here? We are probably stuck in a three-way split between the categories until a new technology is invented.
Samuel serves as Senior Vice President, Chief Investment Officer for the Crews family of banks. He manages the individual investment holdings of his clients, including individuals, families, foundations, and institutions throughout the State of Florida. Samuel has been involved in banking since 1996 and has more than 20 years experience working in wealth management.
Investments are not a deposit or other obligation of, or guaranteed by, the bank, are not FDIC insured, not insured by any federal government agency, and are subject to investment risks, including possible loss of principal.