Chart of the Day: Inflation by the Decade/Paradigm Shift
Today’s Chart of the Day comes from Lance Lambert, @NewsLambert on Twitter, who works for Fortune Magazine. The chart shows total inflation by decade going back to the 1990s.
FDIC-Insured - Backed by the full faith and credit of the U.S. Government
BankFind
This bank is insured by the Federal Deposit Insurance Corporation. The FDIC Certificate ID is 8021. Click on the Certificate ID # to confirm this bank's FDIC coverage using the FDIC's BankFind tool.
EDIE
EDIE lets consumers and bankers know, on a per-bank basis, how the insurance rules and limits apply to a depositor's accounts-what's insured and what portion (if any) exceeds coverage limits at that bank. Check your deposit insurance coverage >>
Today’s Chart of the Day comes from Lance Lambert, @NewsLambert on Twitter, who works for Fortune Magazine. The chart shows total inflation by decade..
Commercial real estate brokers work with clients and lenders to purchase real estate for businesses. A broker is similar to an agent, except brokers..
Storm season begins June 1 in Florida and extends to November 30th. You’ve probably practiced how to keep your home and your family protected, but..
I’m going to take a small detour from my typical Chart of the Day to tell a short story of Aretha Franklin’s will.
Today’s Chart of the Day from Cambria shows the rolling 10-year US stock return going back 108 years to 1914. There are two general periods where..
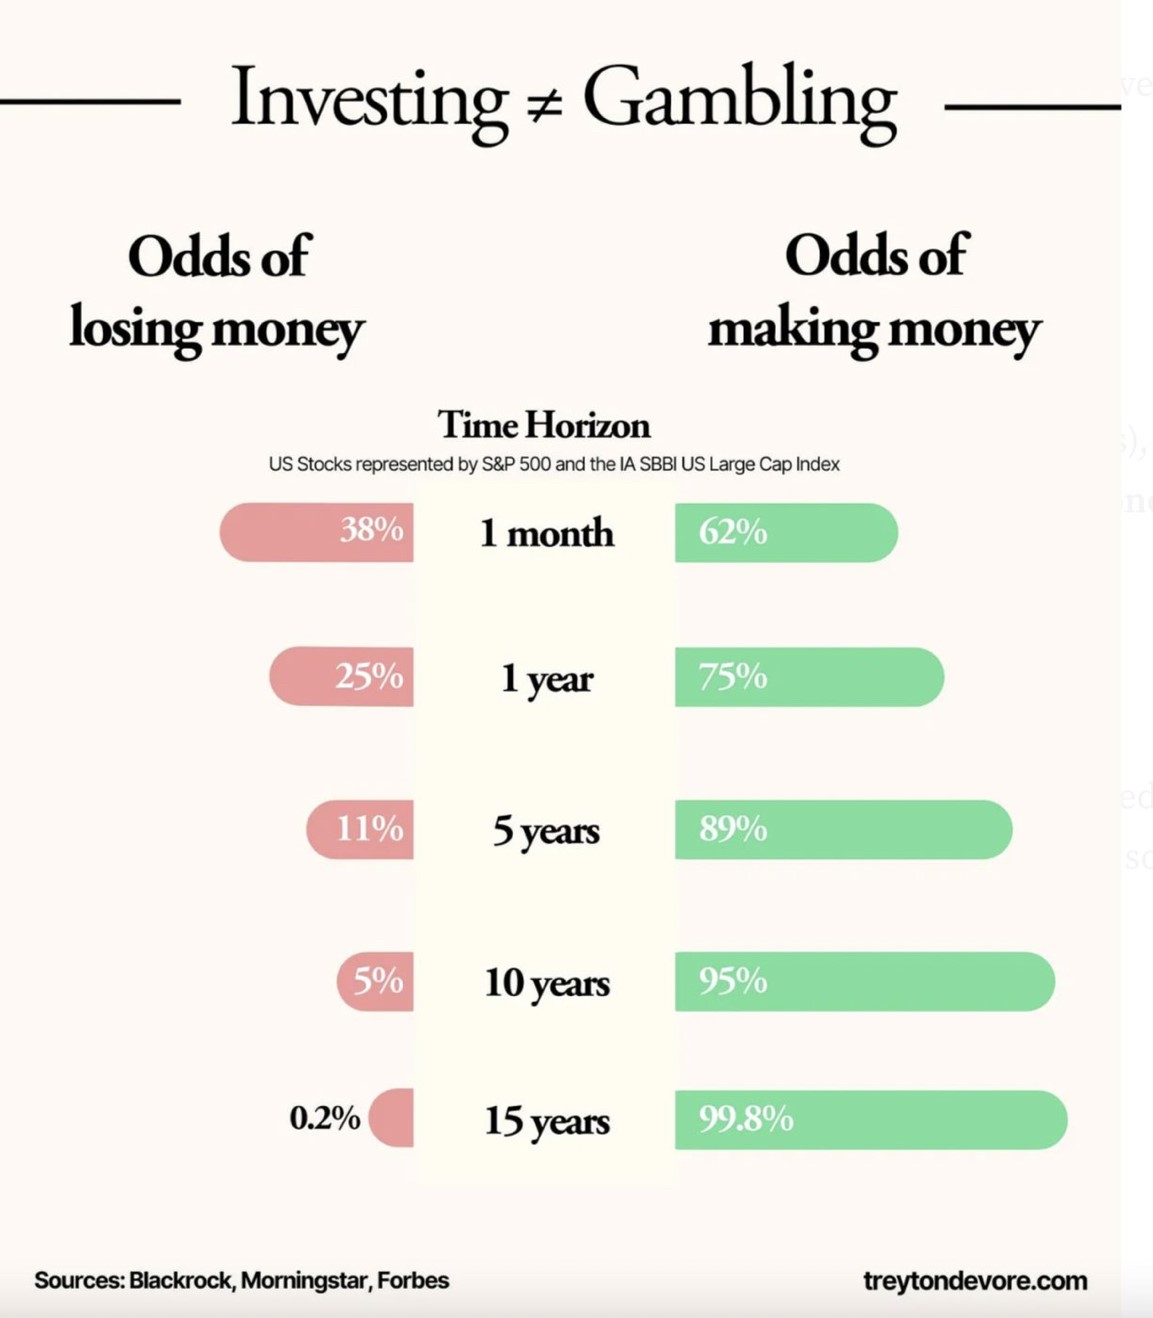
Today’s Chart of the Day from @morganhousel on Twitter illustrates the odds that you will have a positive return in the stock market based on how..
Today’s Chart of the Day is from a CNBC article titled, “With just 8% of new vehicles costing under $30,000, ‘it’s the least affordable car market in..
Today’s Chart of the Day from Invesco’s mid-year outlook shows that high inflation is reducing household disposable income. A closer look shows..
Today’s Chart of the Day comes from the Financial Times and shows the dominance of the US dollar in central bank reserves globally, represented in..
Today’s Chart of the Day is from the Wall Street Journal. Some things have not gone back to “pre-pandemic” days. One is the percentage of those who..
Today’s Chart of the Day comes from re:venture in a discussion on Reddit. It's important to remember that the monthly cost to buy (yellow) is usually..
When it comes to securing the future of a disabled child, establishing a trust is a powerful and proactive step that parents should consider. A..
Today’s Chart of the Day is from S&P Global. If you follow my posts, you will not be surprised that over the last 20 years the S&P 500 index, where..
Today’s Chart of the Day from Econofact.org shows the trend in US birth rates which peaked in 2007 and is now 20% less.
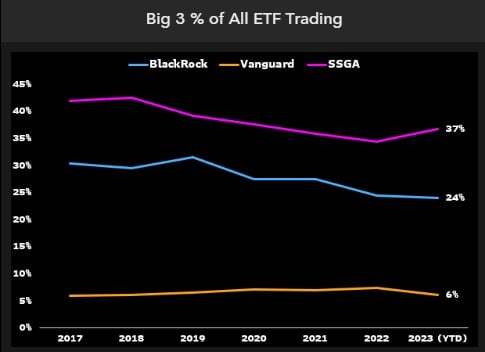
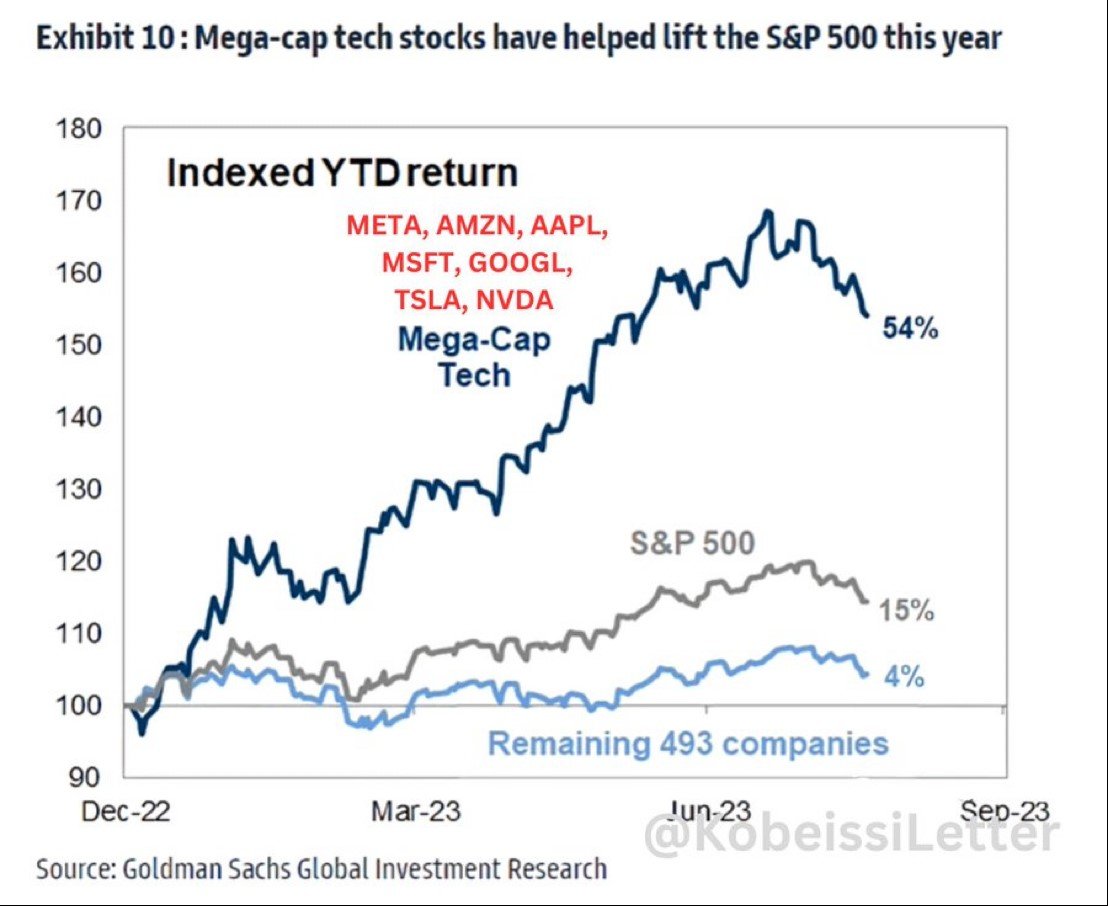
Today’s Chart of the Day is a comment about a unique risk that can occur in successful index funds. For instance, we often hear about what many call..
Today’s Chart of the Day comes from Lance Lambert, @NewsLambert on Twitter, who works for Fortune Magazine. The chart shows total inflation by decade going back to the 1990s.
Commercial real estate brokers work with clients and lenders to purchase real estate for businesses. A broker is similar to an agent, except brokers can assist clients with loans. This requires a knowledge of Florida zoning and tax laws, property management, and loans available to real estate buyers.
Storm season begins June 1 in Florida and extends to November 30th. You’ve probably practiced how to keep your home and your family protected, but what about your business?
I’m going to take a small detour from my typical Chart of the Day to tell a short story of Aretha Franklin’s will.
Today’s Chart of the Day from Cambria shows the rolling 10-year US stock return going back 108 years to 1914. There are two general periods where stocks realized a negative return over a 10-year span: one during the Great Depression in the 1930s and the other during the Great Recession in 2008.
Today’s Chart of the Day from @morganhousel on Twitter illustrates the odds that you will have a positive return in the stock market based on how long you own stocks.
Today’s Chart of the Day is from a CNBC article titled, “With just 8% of new vehicles costing under $30,000, ‘it’s the least affordable car market in modern history,' expert says.”
Today’s Chart of the Day from Invesco’s mid-year outlook shows that high inflation is reducing household disposable income. A closer look shows another interesting note: $100 worth of income in the United States in 1999 is now $170 in 2022, an impressive 70% increase.
Today’s Chart of the Day comes from the Financial Times and shows the dominance of the US dollar in central bank reserves globally, represented in dark blue.
Today’s Chart of the Day is from the Wall Street Journal. Some things have not gone back to “pre-pandemic” days. One is the percentage of those who continue to work from home.
Today’s Chart of the Day comes from re:venture in a discussion on Reddit. It's important to remember that the monthly cost to buy (yellow) is usually more than the cost to rent (blue), but a large difference between the two is not sustainable.
When it comes to securing the future of a disabled child, establishing a trust is a powerful and proactive step that parents should consider. A special needs trust or a supplemental needs trust provides financial stability, asset protection, and preserves eligibility for government benefits. Together we will delve into the key reasons why establishing a trust for a disabled child is crucial and how it can provide long-term security and peace of mind for both the child and their family.
Today’s Chart of the Day is from S&P Global. If you follow my posts, you will not be surprised that over the last 20 years the S&P 500 index, where larger companies make up more of the index than smaller ones, beat actively managed funds an incredible 92.4% of the time. That is a high bar to beat.
Today’s Chart of the Day from Econofact.org shows the trend in US birth rates which peaked in 2007 and is now 20% less.
Today’s Chart of the Day is a comment about a unique risk that can occur in successful index funds. For instance, we often hear about what many call the “Tech-Heavy NASDAQ” which refers to the Invesco QQQ Trust Exchange Traded Fund (ETF), the 5th largest exchange-traded fund in the US.
current_page_num+2: 28 -